L-Root now serving "DURZ" signed responses
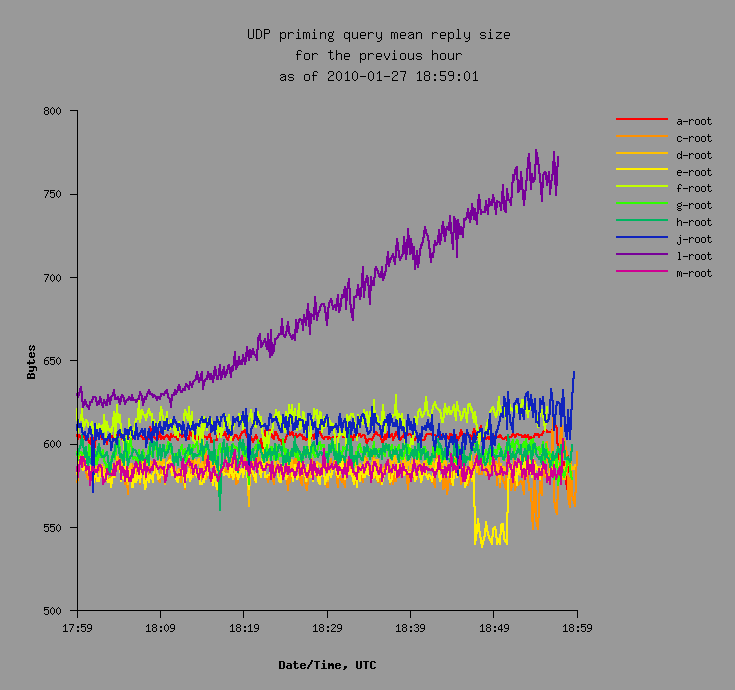
In case you haven't heard, L.ROOT-SERVERS.NET began serving a DNSSEC-signed root zone today. DNS-OARC has been collecting data during the signed root rollout. The graph below shows how L-root's priming response size has increased during the last hour since it first began serving signed responses:
We're also watching the data below to see if there are noticeable increases in priming query rates after signing:
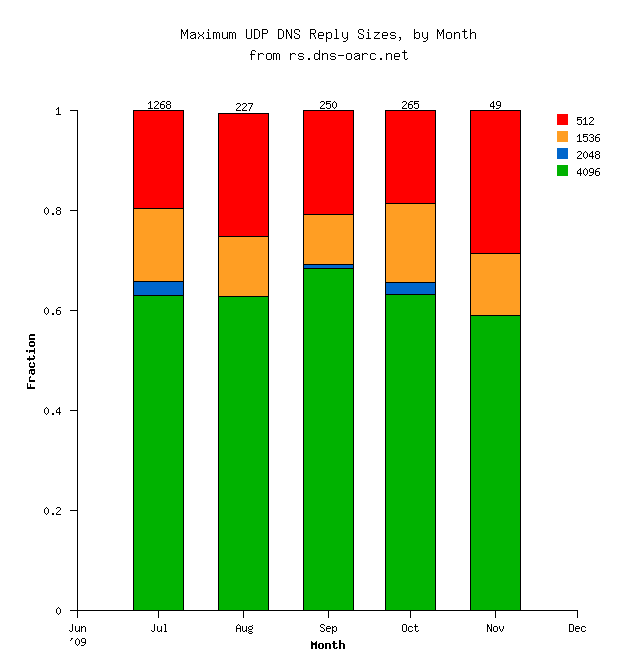 The data probably does not contain enough samples to ascertain any trends. The number of samples in each month is shown at the top of the bars.
 The sample isn't quite as large as I'd like.